Module 6 — The Math Machine
Imagine a machine where you enter a number, the machine follows a rule, and a new number comes out. Many real-world systems work exactly like this — pricing systems, salary growth, distance travelled, and data usage all follow predictable input-output rules.
In this module, you will learn how numbers follow structured rules that create straight-line relationships. You will understand how to identify the rule connecting two values, how to express it using algebra, and how these relationships appear visually on graphs.
What You Will Learn
- Understand input → rule → output relationships
- Recognise linear patterns between variables
- Identify starting value (intercept) and rate of change (slope)
- Translate patterns into linear equations
- Interpret simple linear graphs
Concept 1 — Input → Rule → Output
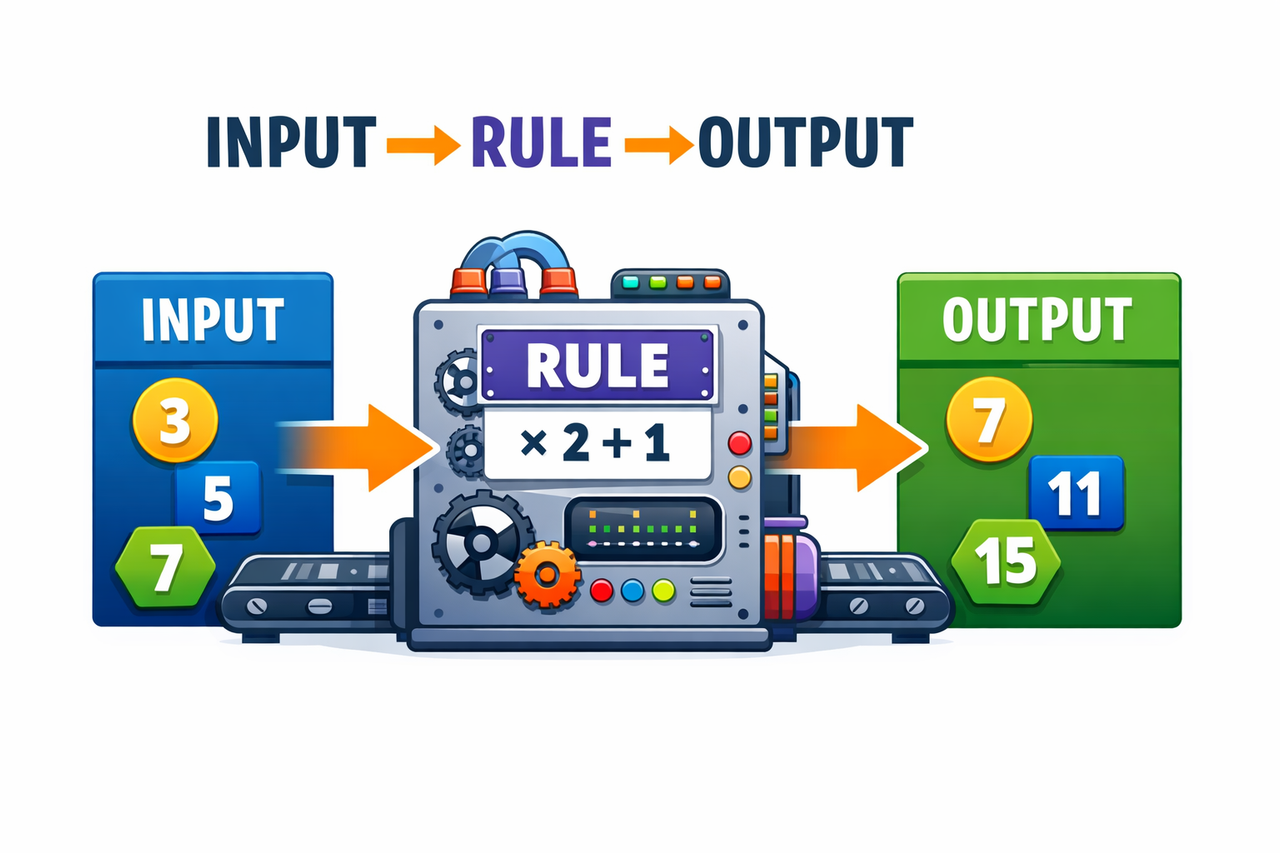
A mathematical relationship works like a machine. You enter a number (input), the machine applies a rule, and a new number is produced (output). If the rule is consistent, the relationship becomes predictable and can be described using algebra.
For example, if the rule is “multiply by 2 and add 1,” every input number will always produce a specific output. This predictable behaviour forms the foundation of linear relationships.
Concept 2 — Discovering the Rule
To understand how a relationship works, we examine how the output changes when the input increases. If the change is always the same, the relationship is called linear.
| Input (x) | Output (y) |
|---|---|
| 1 | 3 |
| 2 | 5 |
| 3 | 7 |
| 4 | 9 |
Notice that every time the input increases by 1, the output increases by 2. This constant change is called the rate of change. Linear relationships always have a constant rate of change.
Concept 3 — Writing the Rule
After identifying a consistent pattern between input and output values, we can express the relationship using an algebraic rule. Linear relationships are written using the general form:
y = mx + c
In this equation:
- x represents the input value
- y represents the output value
- m represents the rate of change (how much the output increases when input increases by 1)
- c represents the starting value (the output when input is zero)
Suppose the rule is “multiply the input by 2 and then add 1”. The algebraic equation becomes:
y = 2x + 1
We can verify the rule by testing values:
- If x = 1 → y = 2(1) + 1 = 3
- If x = 2 → y = 2(2) + 1 = 5
- If x = 3 → y = 2(3) + 1 = 7
Since the equation produces the same outputs shown in the table and machine example, the rule correctly represents the linear relationship.
Concept 4 — From Rule to Graph (Why It Becomes a Straight Line)
A graph is simply a picture of the input-output machine. Every input value x produces an output value y. When we plot each pair (x, y) as a point, we can see the relationship visually.
Step-by-Step: Turning a Rule into Points
- Choose a few input values (x).
- Use the rule to calculate the output values (y).
- Write each result as an ordered pair (x, y).
- Plot the points on a coordinate grid.
Let’s use the rule:
y = 2x + 1
Now we generate points:
| x (Input) | y = 2x + 1 (Output) | Point |
|---|---|---|
| 0 | 1 | (0, 1) |
| 1 | 3 | (1, 3) |
| 2 | 5 | (2, 5) |
| 3 | 7 | (3, 7) |
Why a Straight Line?
Because the output increases by the same amount each time the input increases by 1. That constant change creates a consistent direction on the graph, so the points align in a straight path.
What Do m and c Mean Visually?
c is where the line crosses the y-axis (when x = 0). Here c = 1, so the line starts at (0,1). m is the “step pattern” of the line. Here m = 2, meaning: for every +1 in x, y goes +2.
Mini Logic Map (Machine → Table → Graph)
Machine: apply the rule to inputs → outputs
Table: organise the pairs (x, y)
Graph: plot the pairs and see the relationship as a line
In the next stage, you will practise building tables, writing rules, and predicting outputs. Later, in Module 7, you will learn deeper graph storytelling and how graphs explain real-world trends.
Guided Practice — The Math Machine
Use the given rule to calculate the outputs. Follow the input → rule → output thinking process.
Q1. Rule: y = 3x + 2, find y when x = 2
Solution: y = 3(2) + 2 = 6 + 2 = 8
Q2. Rule: y = 2x + 5, find y when x = 4
Solution: y = 2(4) + 5 = 8 + 5 = 13
Q3. Rule: y = x + 7, find y when x = 6
Solution: y = 6 + 7 = 13
Q4. Rule: y = 5x, find y when x = 3
Solution: y = 5(3) = 15
Q5. Rule: y = 4x + 1, find y when x = 5
Solution: y = 4(5) + 1 = 20 + 1 = 21
Q6. Rule: y = 2x − 1, find y when x = 8
Solution: y = 2(8) − 1 = 16 − 1 = 15
Thinking Tip
Always substitute the value of x into the rule first, perform multiplication before addition or subtraction, and verify the result carefully.
Common Mistakes — Function Rules
Mistake 1 — Forgetting Substitution
Students sometimes forget to replace x with the given value before calculating. Always substitute the number first, then solve step by step.
Mistake 2 — Wrong Operation Order
Multiplication must be performed before addition or subtraction. For example, in y = 2x + 5, calculate 2x first, then add 5.
Mistake 3 — Ignoring the Starting Value
The constant value (c) represents the starting output when x = 0. Ignoring this value leads to incorrect rules and wrong graphs.
Mistake 4 — Assuming All Patterns Are Linear
If the output does not increase by the same amount each time, the relationship is not linear. Always check whether the change is constant.